Plus AI Feature
Stuck building a strategy deck? Use these Consulting & Business Prompt Ideas for Nano Banana to generate professional frameworks, org charts, and analysis slides that actually look good. Because Nano Banana Pro handles text rendering perfectly, you can create complex diagrams with accurate labels and titles directly in your presentation. It is a lifesaver for executive summaries or client pitches where details matter.
27 prompts

Create a meeting notes slide template with attendees, agenda, actions, and decisions. Use a structured documentation style with clear section headers (Attendees, Agenda, Discussion, Decisions, Actions), checkbox action items, owner initials badges, due date fields, clean white background with subtle blue headers, note-taking aesthetic, and organized documentation typography.

Design a slide explaining the design thinking process with 5 stages. Use a creative workshop style with five connected hexagonal stages (Empathize, Define, Ideate, Prototype, Test), sticky note accents, lightbulb and pencil icons, collaborative whiteboard aesthetic, innovation-inspiring purple and orange colors, and creative process typography.

Create a slide for new hire orientation showing first week schedule and resources. Use a welcome aboard style with friendly illustrated office scene, day-by-day schedule timeline, helpful resource icons, team introduction photos, company values highlights, warm welcoming colors (orange, teal), and friendly onboarding typography.

Design a slide summarizing annual achievements, revenue growth, and key metrics. Use a year-in-review style with large year number as backdrop, key metric cards arranged attractively, milestone achievement badges, upward trending charts, celebratory yet professional color scheme, annual report editorial aesthetic, and accomplished reporting typography.

Create a case study slide showing client challenge, solution, and quantified results. Use a success story style with three-act structure (Challenge, Solution, Results), client logo prominent, dramatic before/after metrics with green arrows, testimonial quote, trophy or award graphic, case study blue and gold palette, and compelling narrative typography.
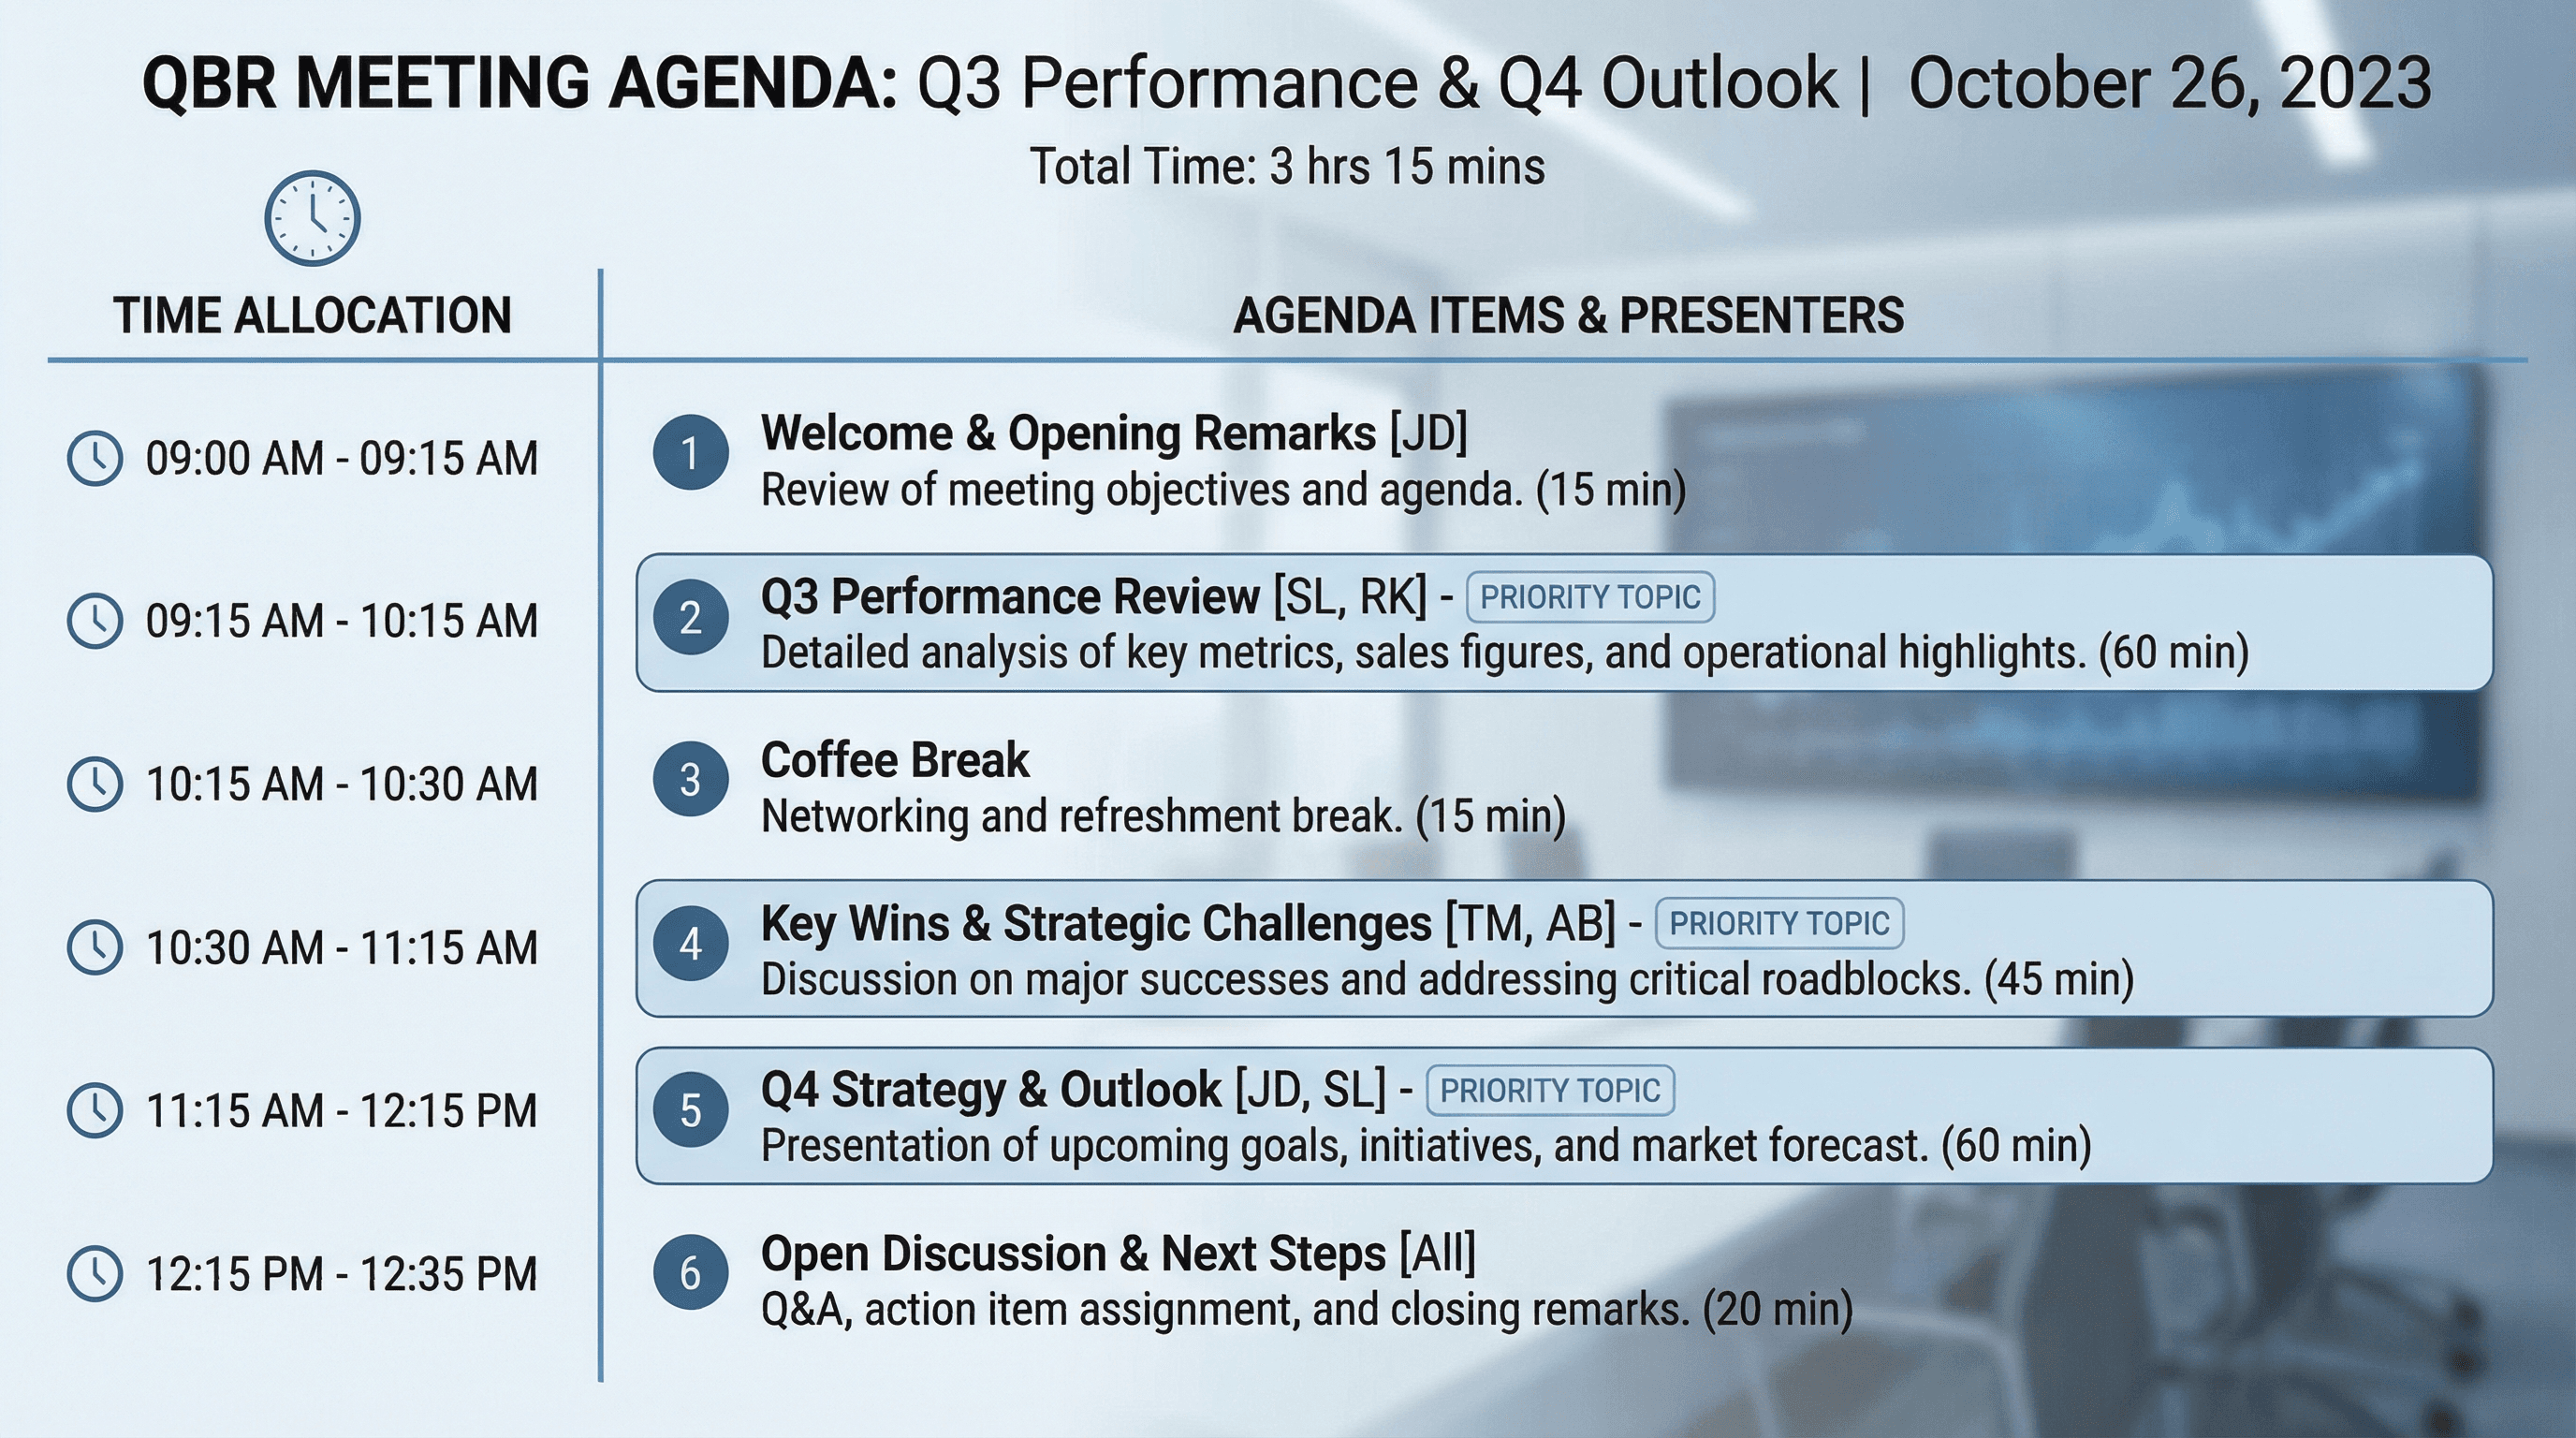
Design an agenda slide for QBR meeting with timing and discussion topics. Use a meeting structure style with numbered agenda items, time allocations in sidebar, presenter initials, priority topic highlighting, clock graphic, clean corporate blue palette, meeting room professional aesthetic, and organized agenda typography.

Create an inspiring slide presenting the company vision and mission statement. Use an aspirational style with dramatic hero image background (sunrise, mountain summit, horizon), vision statement in large elegant serif font, mission in supporting text, subtle light rays, inspirational color gradient (purple to orange), and visionary leadership typography.

Create a C-suite dashboard slide with revenue, margin, and operational KPIs. Use a CEO briefing style with large metric tiles, trend sparklines, red/green performance indicators, YoY comparison percentages, gauge charts for targets, clean dark theme with white metrics, premium executive aesthetic, and commanding leadership typography.

Design a phased implementation roadmap with dependencies and resource needs. Use a delivery planning style with horizontal phase blocks (Foundation, Build, Deploy, Optimize), vertical workstream rows, dependency arrows connecting tasks, resource allocation bars, RAG status indicators, PMO aesthetic, and structured implementation typography.

Create a slide summarizing 5 key findings from customer research interviews. Use a research insights style with numbered insight cards, supporting quote snippets in italics, relevant data points, lightbulb icons, interview respondent count badge, sticky note accents, qualitative research aesthetic, and thoughtful insight-focused typography.

Design a slide showing budget allocation across departments with pie/donut chart. Use a financial planning style with colorful donut chart segments, percentage and dollar labels, department icons, comparison to prior year indicators, budget variance callouts, CFO presentation aesthetic, and clear financial reporting typography.

Create a spider/radar chart slide showing digital maturity across 6 dimensions. Use a diagnostic assessment style with hexagonal radar chart, current state vs target state overlay lines, dimension labels around perimeter, maturity level scale (1-5), gap highlighting, technology audit aesthetic, and analytical assessment typography.
How to use these Consulting & Business Prompt Ideas for Nano Banana prompts
These prompts are designed to help you quickly generate professional visual assets for strategy decks, client presentations, and business analyses. You can use them as a direct template for your slides or as inspiration to visualize complex frameworks. Browse through the examples to see how we structure requests for diagrams, charts, and organizational models, then swap in your specific industry terms or client data to get a custom result.
Be specific about the framework you want to visualize. Nano Banana understands standard business concepts, so using specific terminology helps. Instead of asking for a generic business diagram, ask for a SWOT analysis, a flywheel model, or a value chain diagram. Naming the specific framework gives the AI a clear structural blueprint to follow, which results in a much more usable image for your slide.
Take full advantage of Nano Banana Pro's text rendering capabilities. Unlike older image generators that struggle with spelling, this model is exceptional at placing accurate text inside images. You should explicitly list the labels, titles, and axis descriptions you want to appear in the diagram. For example, if you are generating a roadmap, include instructions like label the phases Q1 Planning, Q2 Execution, and Q3 Review to save yourself from having to add text boxes manually later.
Define the aesthetic to match a corporate environment. Consulting presentations usually require a clean, high-end look. To avoid getting images that look too artistic or moody, use style descriptors like flat vector design, minimalist corporate style, or white background with navy blue accents. This ensures the output integrates seamlessy into a professional PowerPoint or Google Slides deck.
Visualizing abstract processes is a huge time-saver here. If you are trying to explain a complex workflow or a change management strategy, you can generate a step-by-step chevron process or a circular loop diagram. Because you can include the actual step names in the prompt, the result is a ready-to-use visual that replaces a boring bulleted list.
Creating stakeholder maps and organizational charts is another perfect scenario. You can describe a hierarchy or a matrix structure and have Nano Banana populate the boxes with role titles like CEO, VP of Sales, or Operations Lead. It handles the layout and the typography at the same time, giving you a polished org design without the frustration of manually aligning shapes and connectors.
Work directly in Google Slides and PowerPoint — no need to learn a new tool
Never start from scratch again, just tell us what kind of presentation you want to make.
Add, remix, and rewrite your slides to fine-tune your presentation.
You can dictate the exact layout composition to fit your slide content. If you know you need space on the left side of the slide for your main bullet points, tell Nano Banana to place the diagram on the right side. The model follows layout instructions closely, allowing you to compose the image specifically for a split-screen slide design.
Try describing your brand's color palette in the prompt. Since Nano Banana adheres strictly to color instructions, you can list your specific brand colors (like slate grey, teal, and coral) to ensure the generated charts and diagrams match the rest of your presentation template instantly.