Plus AI Feature
Dreading the hours it takes to manually draw system architecture diagrams? Check out these Technology Prompt Ideas for Nano Banana to instantly generate cloud infrastructure layouts, software engineering flows, and detailed technical schemas. Nano Banana Pro is exceptional at rendering text within images, so your labels and annotations will come out sharp and spelled correctly. These are lifesavers for engineering syncs or explaining the "how it works" slide to leadership.
29 prompts

Design a slide presenting funding amount, use of funds, and expected milestones. Use an investment ask style with large funding amount in bold ($X Million), pie chart showing fund allocation (Product, Sales, Marketing, Ops), milestone targets with achievement timeline, handshake partnership imagery, confident ask colors, and direct funding-focused typography.
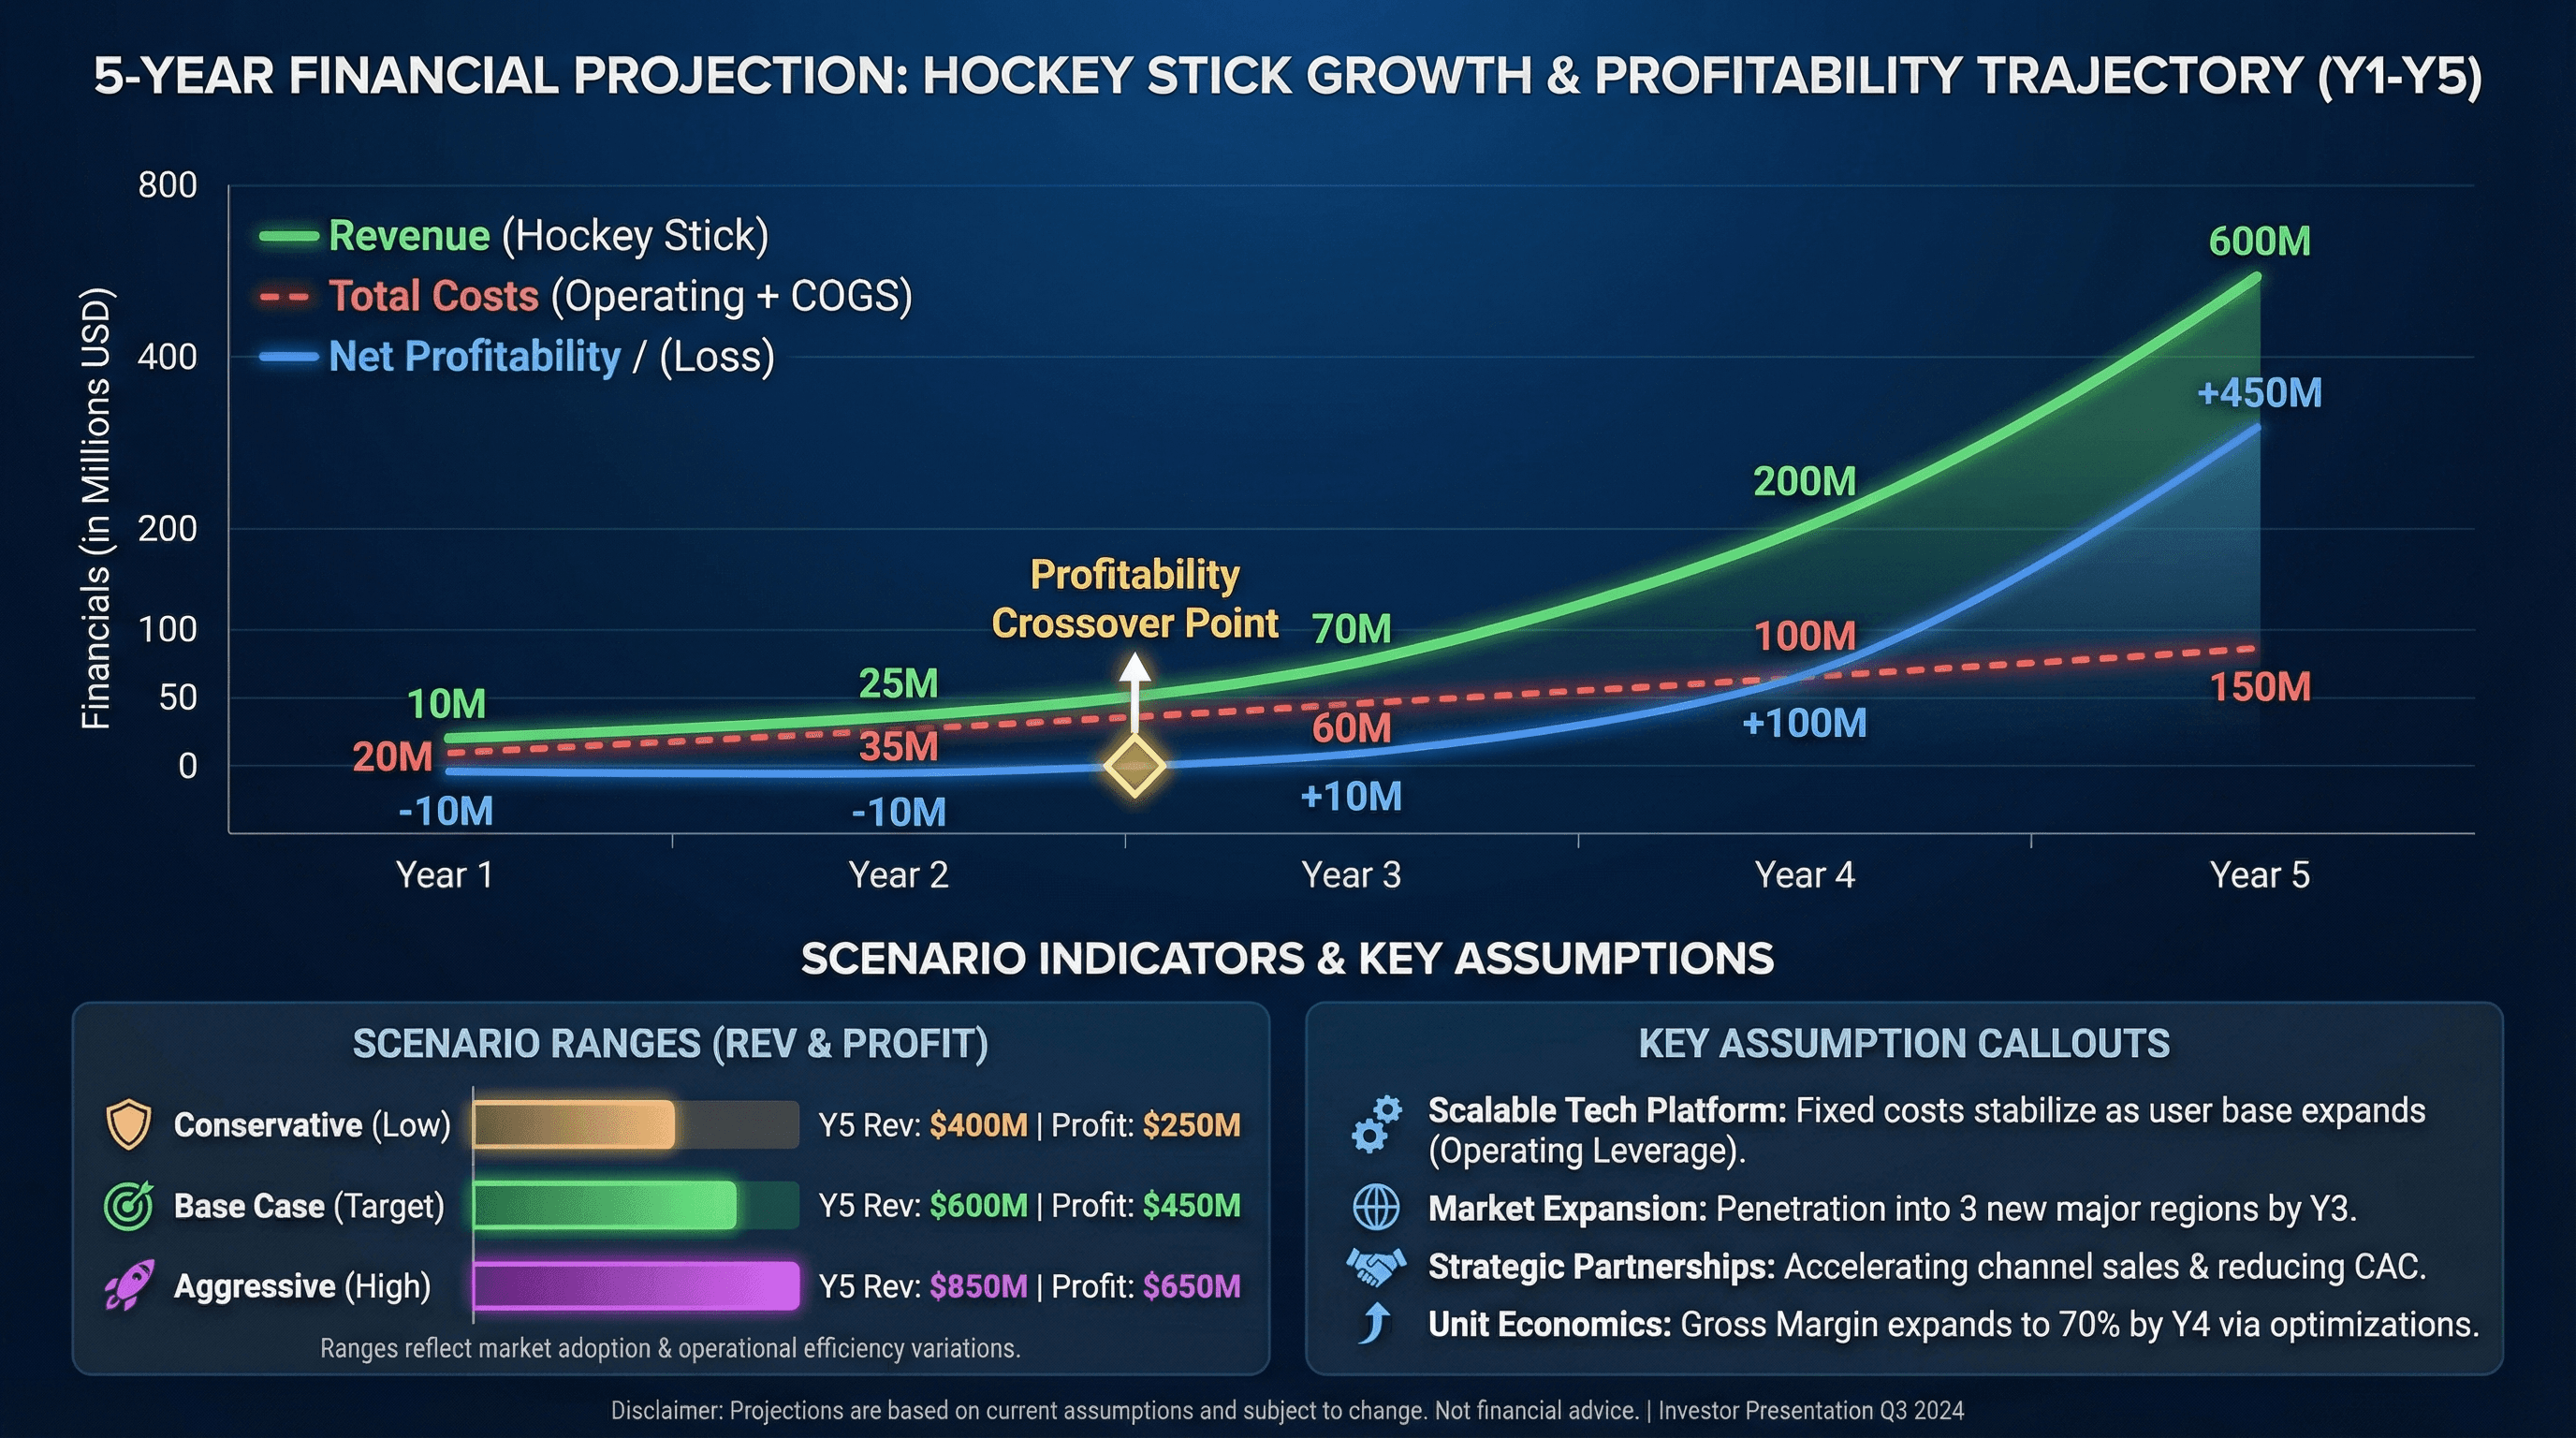
Create a 5-year financial projection slide with revenue, costs, and profitability. Design in a hockey stick projection style with multi-line chart showing revenue growth, profitability crossover point highlighted, key assumption callouts, conservative/base/aggressive scenario indicators, investor-friendly formatting, and professional financial typography.

Design a slide introducing founding team with photos, roles, and credentials. Use a team spotlight style with professional headshot photos in consistent circular frames, name and title below each, impressive credential badges (ex-Google, Stanford MBA), team chemistry connection lines, warm trustworthy background, and credibility-building typography.
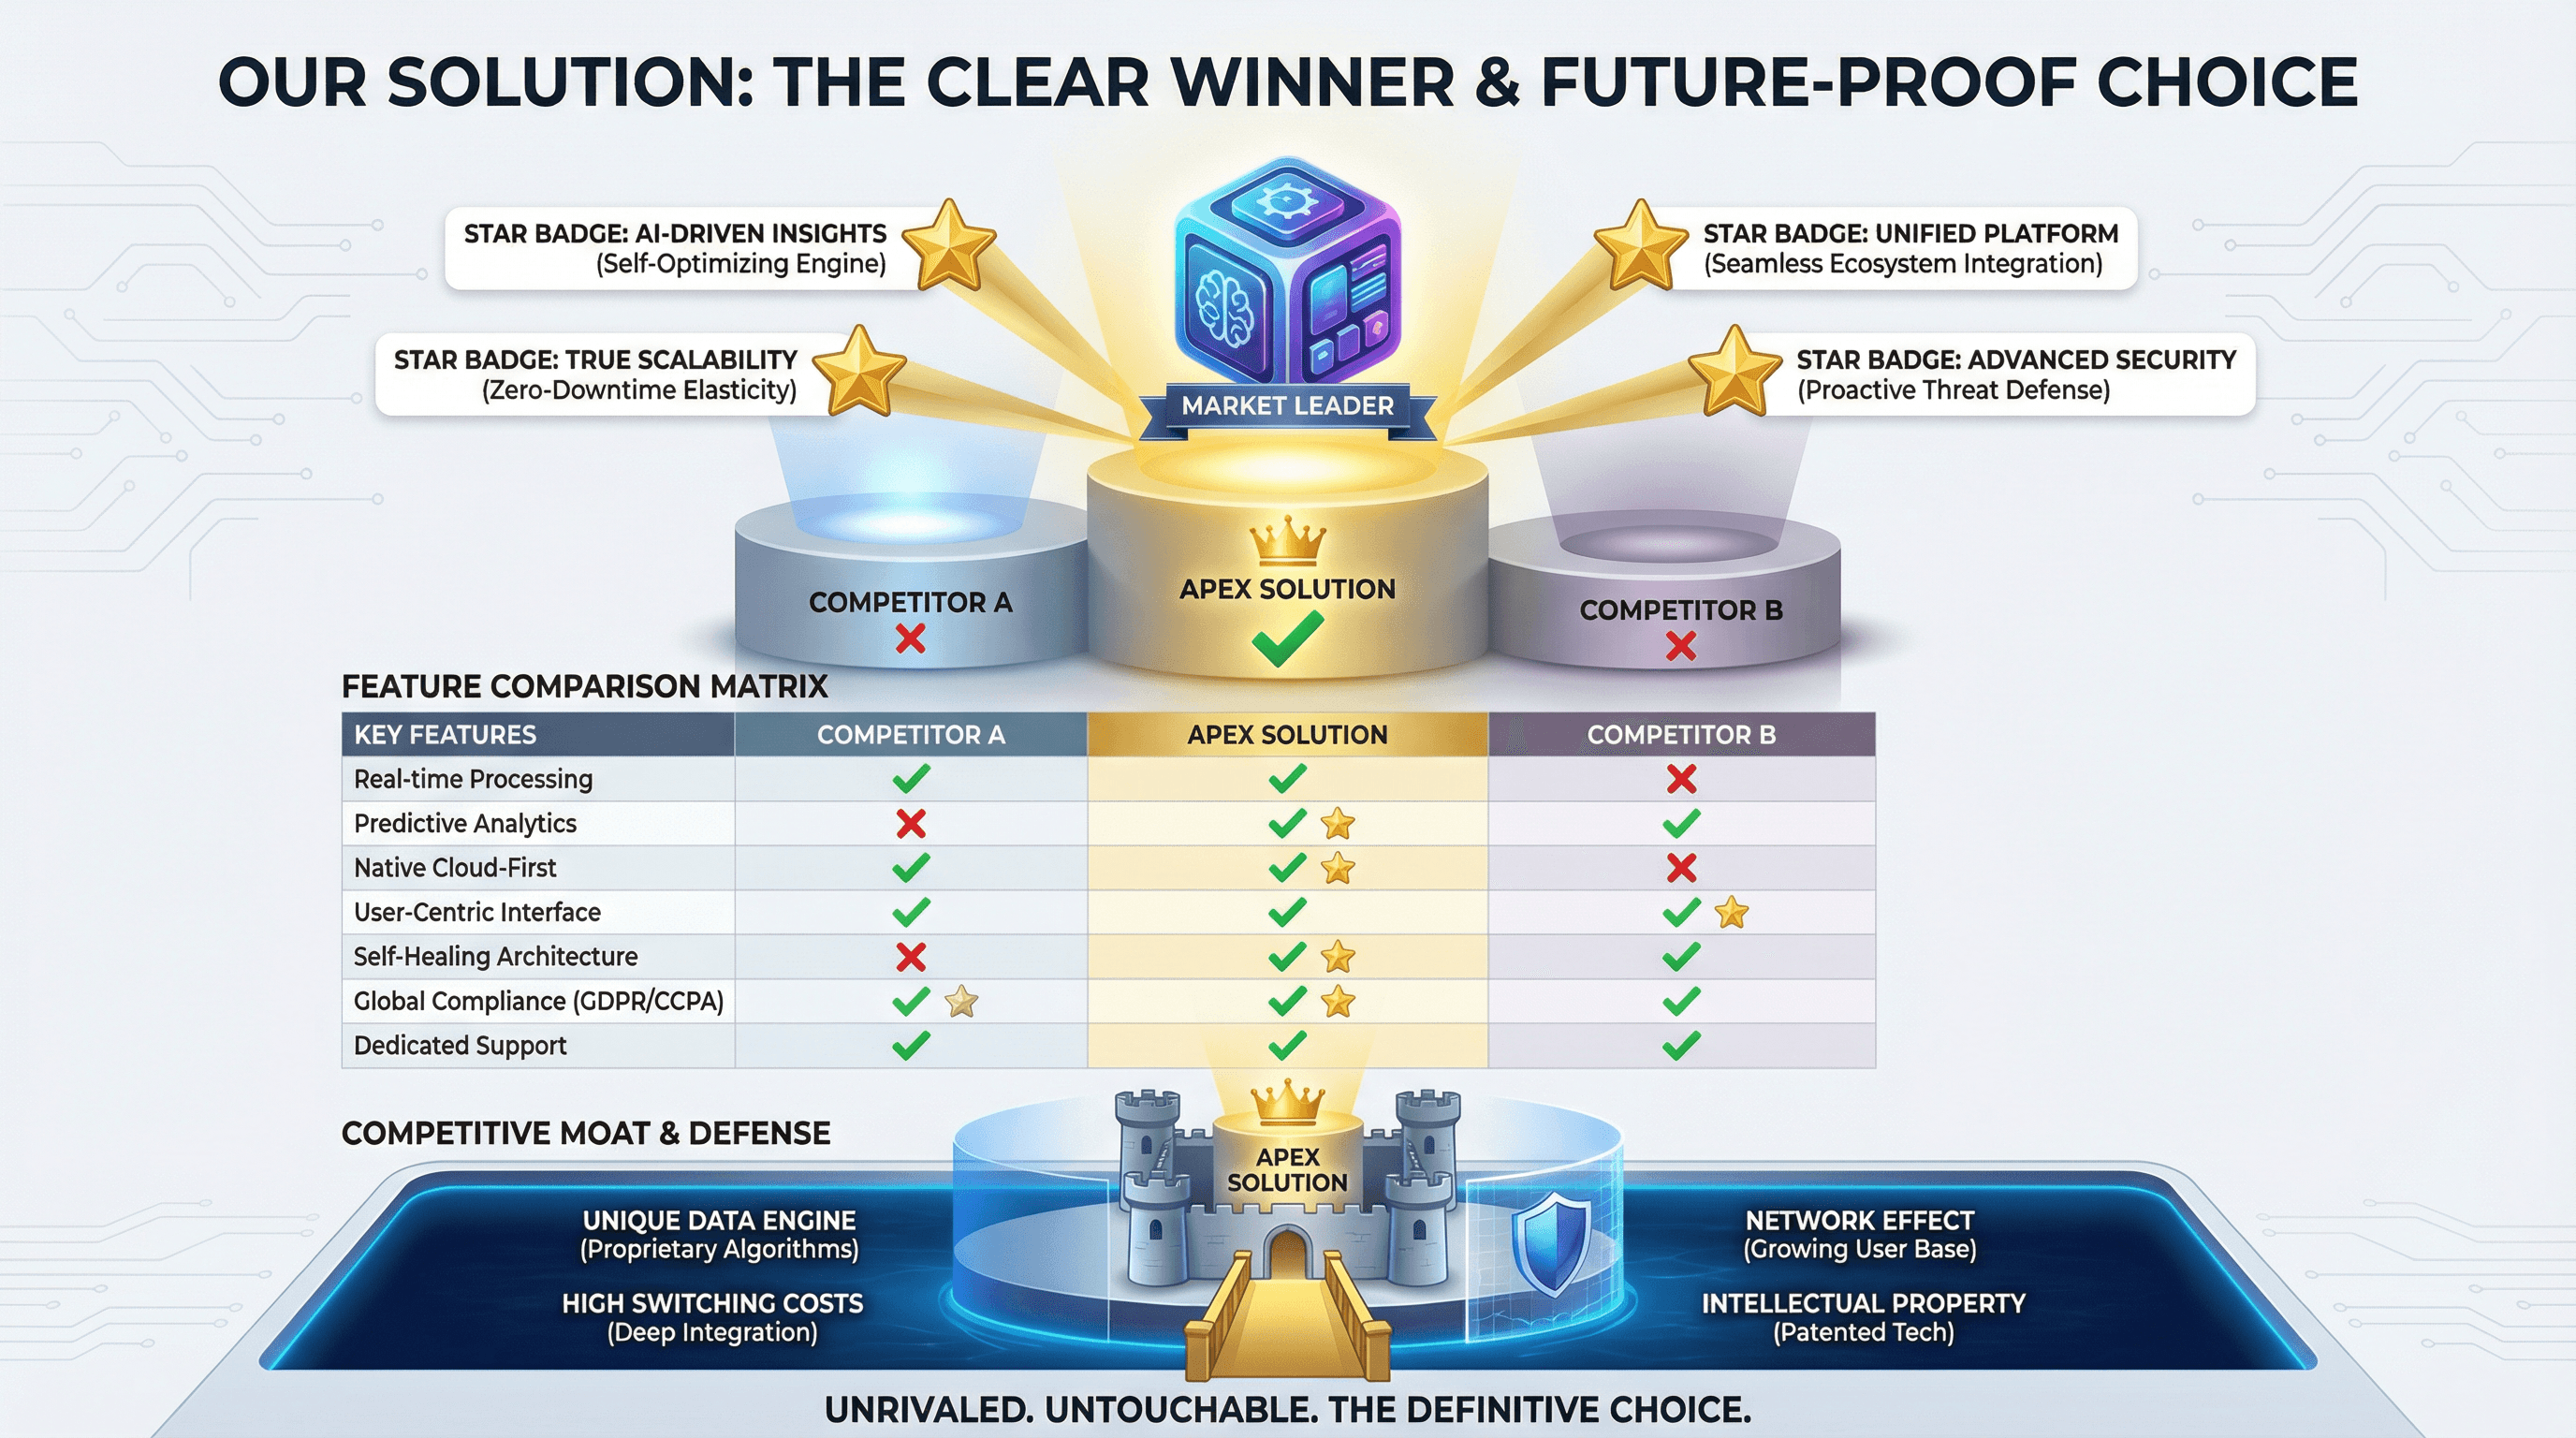
Create a slide comparing your solution to competitors with feature matrix. Use a winner's podium style with your product on top center position, competitor comparison table with green checkmarks vs red X marks, unique differentiator callouts with star badges, competitive moat visualization, and confident differentiation typography.

Design a slide showcasing growth metrics, user numbers, and milestones achieved. Use an up-and-to-the-right style with hockey stick growth chart as hero visual, large milestone numbers with achievement dates, customer logo parade, user count with growth percentage, celebratory confetti accents, momentum-building gradient, and exciting traction typography.

Create a slide explaining revenue streams, pricing model, and unit economics. Design in a unit economics style with revenue flow diagram showing money movement, pricing tier comparison, LTV/CAC ratio visualization, recurring revenue indicators, dollar bill and coin graphics, financial model aesthetic, and clear business model typography.
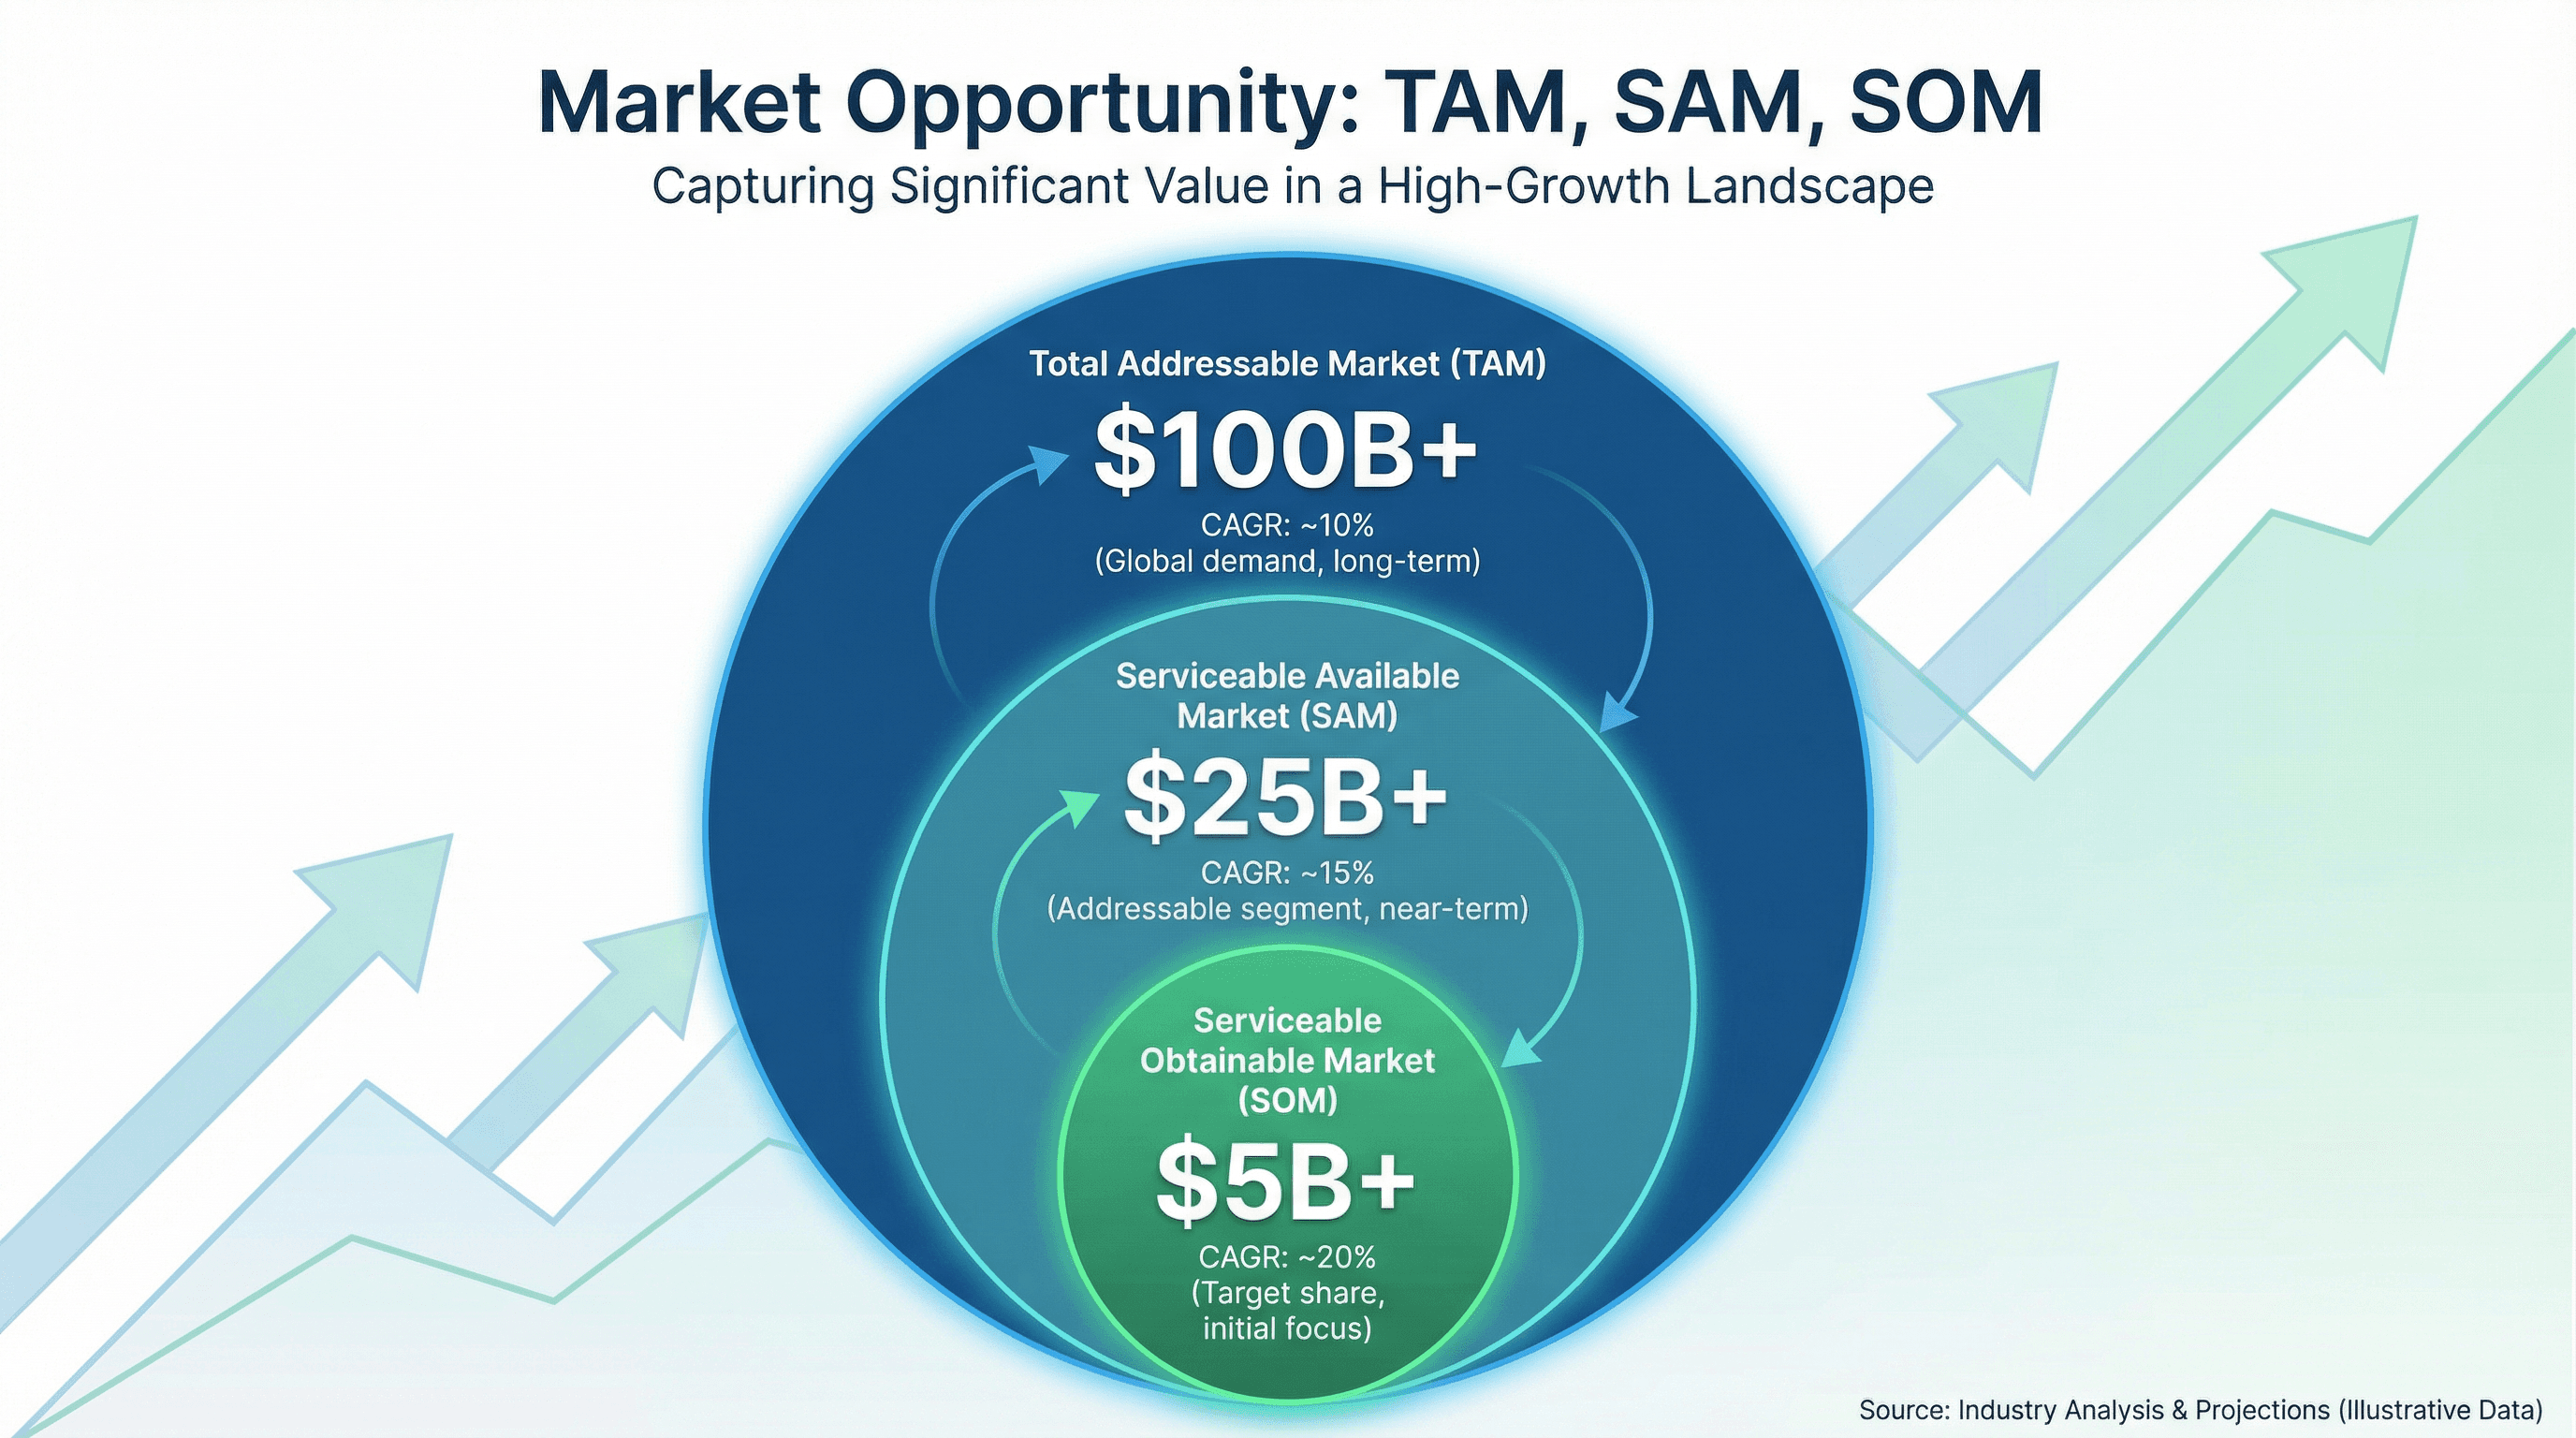
Design a slide showing Total Addressable Market, Serviceable Market, and Target Market. Use a market opportunity style with three concentric circles (largest TAM to smallest SOM), dollar amounts in billions, market growth percentages, upward trending background graphic, investor-friendly blue and green colors, and compelling market sizing typography.

Create a slide presenting your product solution with key benefits. Use a hero product style with product screenshot/mockup as centerpiece with subtle glow, benefit icons radiating outward, before/after transformation graphic, green positive colors suggesting relief, clean white space, Apple-inspired minimalism, and confident solution-focused typography.

Design a slide clearly articulating the market problem your startup solves. Use an empathy-driven style with large problem statement in bold red text, frustrated user persona illustration, pain point statistics in alarming callout boxes, broken/cracked visual metaphors, dark moody background creating tension, and dramatic problem-focused typography.

Create a slide with a 2x2 matrix showing features plotted by impact vs effort. Design in a strategic planning style with quadrant grid in contrasting colors (green for quick wins, red for money pit), plotted feature dots with labels, axis arrows with gradient fills, decision framework aesthetic, and executive presentation typography.

Design a dashboard slide tracking technical debt items by severity and estimated effort. Use a project management tool aesthetic with Jira-inspired styling, severity badges in red/orange/yellow, effort estimation poker cards, burndown chart graphics, backlog list formatting, agile sprint borders, and practical Atlassian-style typography.

Create a slide presenting A/B test results with statistical significance and conversion metrics. Use a data science experiment style with split comparison layout (Control A vs Variant B), bar charts with confidence intervals, p-value callouts, statistical formula accents, lab experiment beaker imagery, and precise scientific Helvetica typography.
How to use these Technology Prompt Ideas for Nano Banana prompts
Welcome to the technical side of the library. This collection focuses on visualizing code structures, IT infrastructure, and those complex systems that are often difficult to explain with words alone. Browse through these examples to see how you can turn a dense architecture spec or a workflow document into a clean, readable diagram right inside your presentation slides. You can copy a prompt that looks close to what you need and simply swap out the specific labels to match your technology stack.
Start by clearly defining the visual style you need for the context of your meeting. Do you need a polished, flat vector illustration for a client pitch deck, or a rough "hand-drawn" whiteboard sketch for an internal engineering sync? Specifying the aesthetic helps the AI pick the right color palette, line weights, and icon styles to match the tone of your presentation.
Take full advantage of Nano Banana Pro's ability to render accurate text. Unlike other tools you might have used in the past, this model is built to handle specific labels, titles, and annotations correctly. Don't be vague; list exactly what you want written on your database icons, server nodes, or flow arrows. You can say things like "label the central server 'Mainframe' and the output 'Analytics Dashboard'" to get precise results.
Give direction on the layout flow to ensure the diagram makes logical sense. Telling the AI to arrange elements from "left to right" for a timeline or in a "hub and spoke" pattern for a network diagram helps structure the image correctly. If you are visualizing a process, specify the start and end points so the visual hierarchy follows the path of your data.
One of the strongest use cases for these prompts is visualizing cloud infrastructure and system architecture. Instead of spending hours dragging boxes around in a separate diagramming tool, you can generate a professional overview of your microservices or server setup directly on the slide. This is perfect for high-level overviews where you need to show stakeholders how different components interact without getting bogged down in the nitty-gritty details.
These prompts also shine when mapping out development workflows and CI/CD pipelines. You can create clear, step-by-step visualizations showing how code moves from a local commit to production deployment. It makes onboarding new engineers significantly faster when they can see the "happy path" of your release process at a glance, complete with readable labels for each stage like "Build," "Test," and "Deploy."
Work directly in Google Slides and PowerPoint — no need to learn a new tool
Never start from scratch again, just tell us what kind of presentation you want to make.
Add, remix, and rewrite your slides to fine-tune your presentation.
If you are presenting technical concepts to non-technical stakeholders, try asking for a "simplified abstraction" or "isometric 3D" style. This helps strip away the complex wiring diagrams and focuses on the high-level logic, which is usually what leadership wants to see anyway.
Use color coding instructions to make your diagrams instantly readable. You can tell Nano Banana to "use blue for all frontend components and orange for backend services." Since the model follows design instructions closely, this creates a visual shorthand that helps your audience distinguish between different parts of your stack without you having to explain it verbally.